
Tutorial: Creating Charts with CRUDBooster Page Builder


In this tutorial, we’ll explore how to create charts in CRUDBooster using the Page Builder feature.
Page Builder is a powerful feature in CRUDBooster that allows you to create custom module pages effortlessly. You can design your own layout, add various elements, and include charts—all with a simple drag-and-drop interface.
Let’s dive into the step-by-step process of building a chart using Page Builder in CRUDBooster.
Case Study: Visualizing Member Growth Data (2024)
In this example, we’ll create a chart to display monthly member growth data for 2024.
Prerequisites
CRUDBooster v7 installed on your Laravel project.
Member data for the year 2024 (adjust according to your dataset). (Click here download dummy member data).
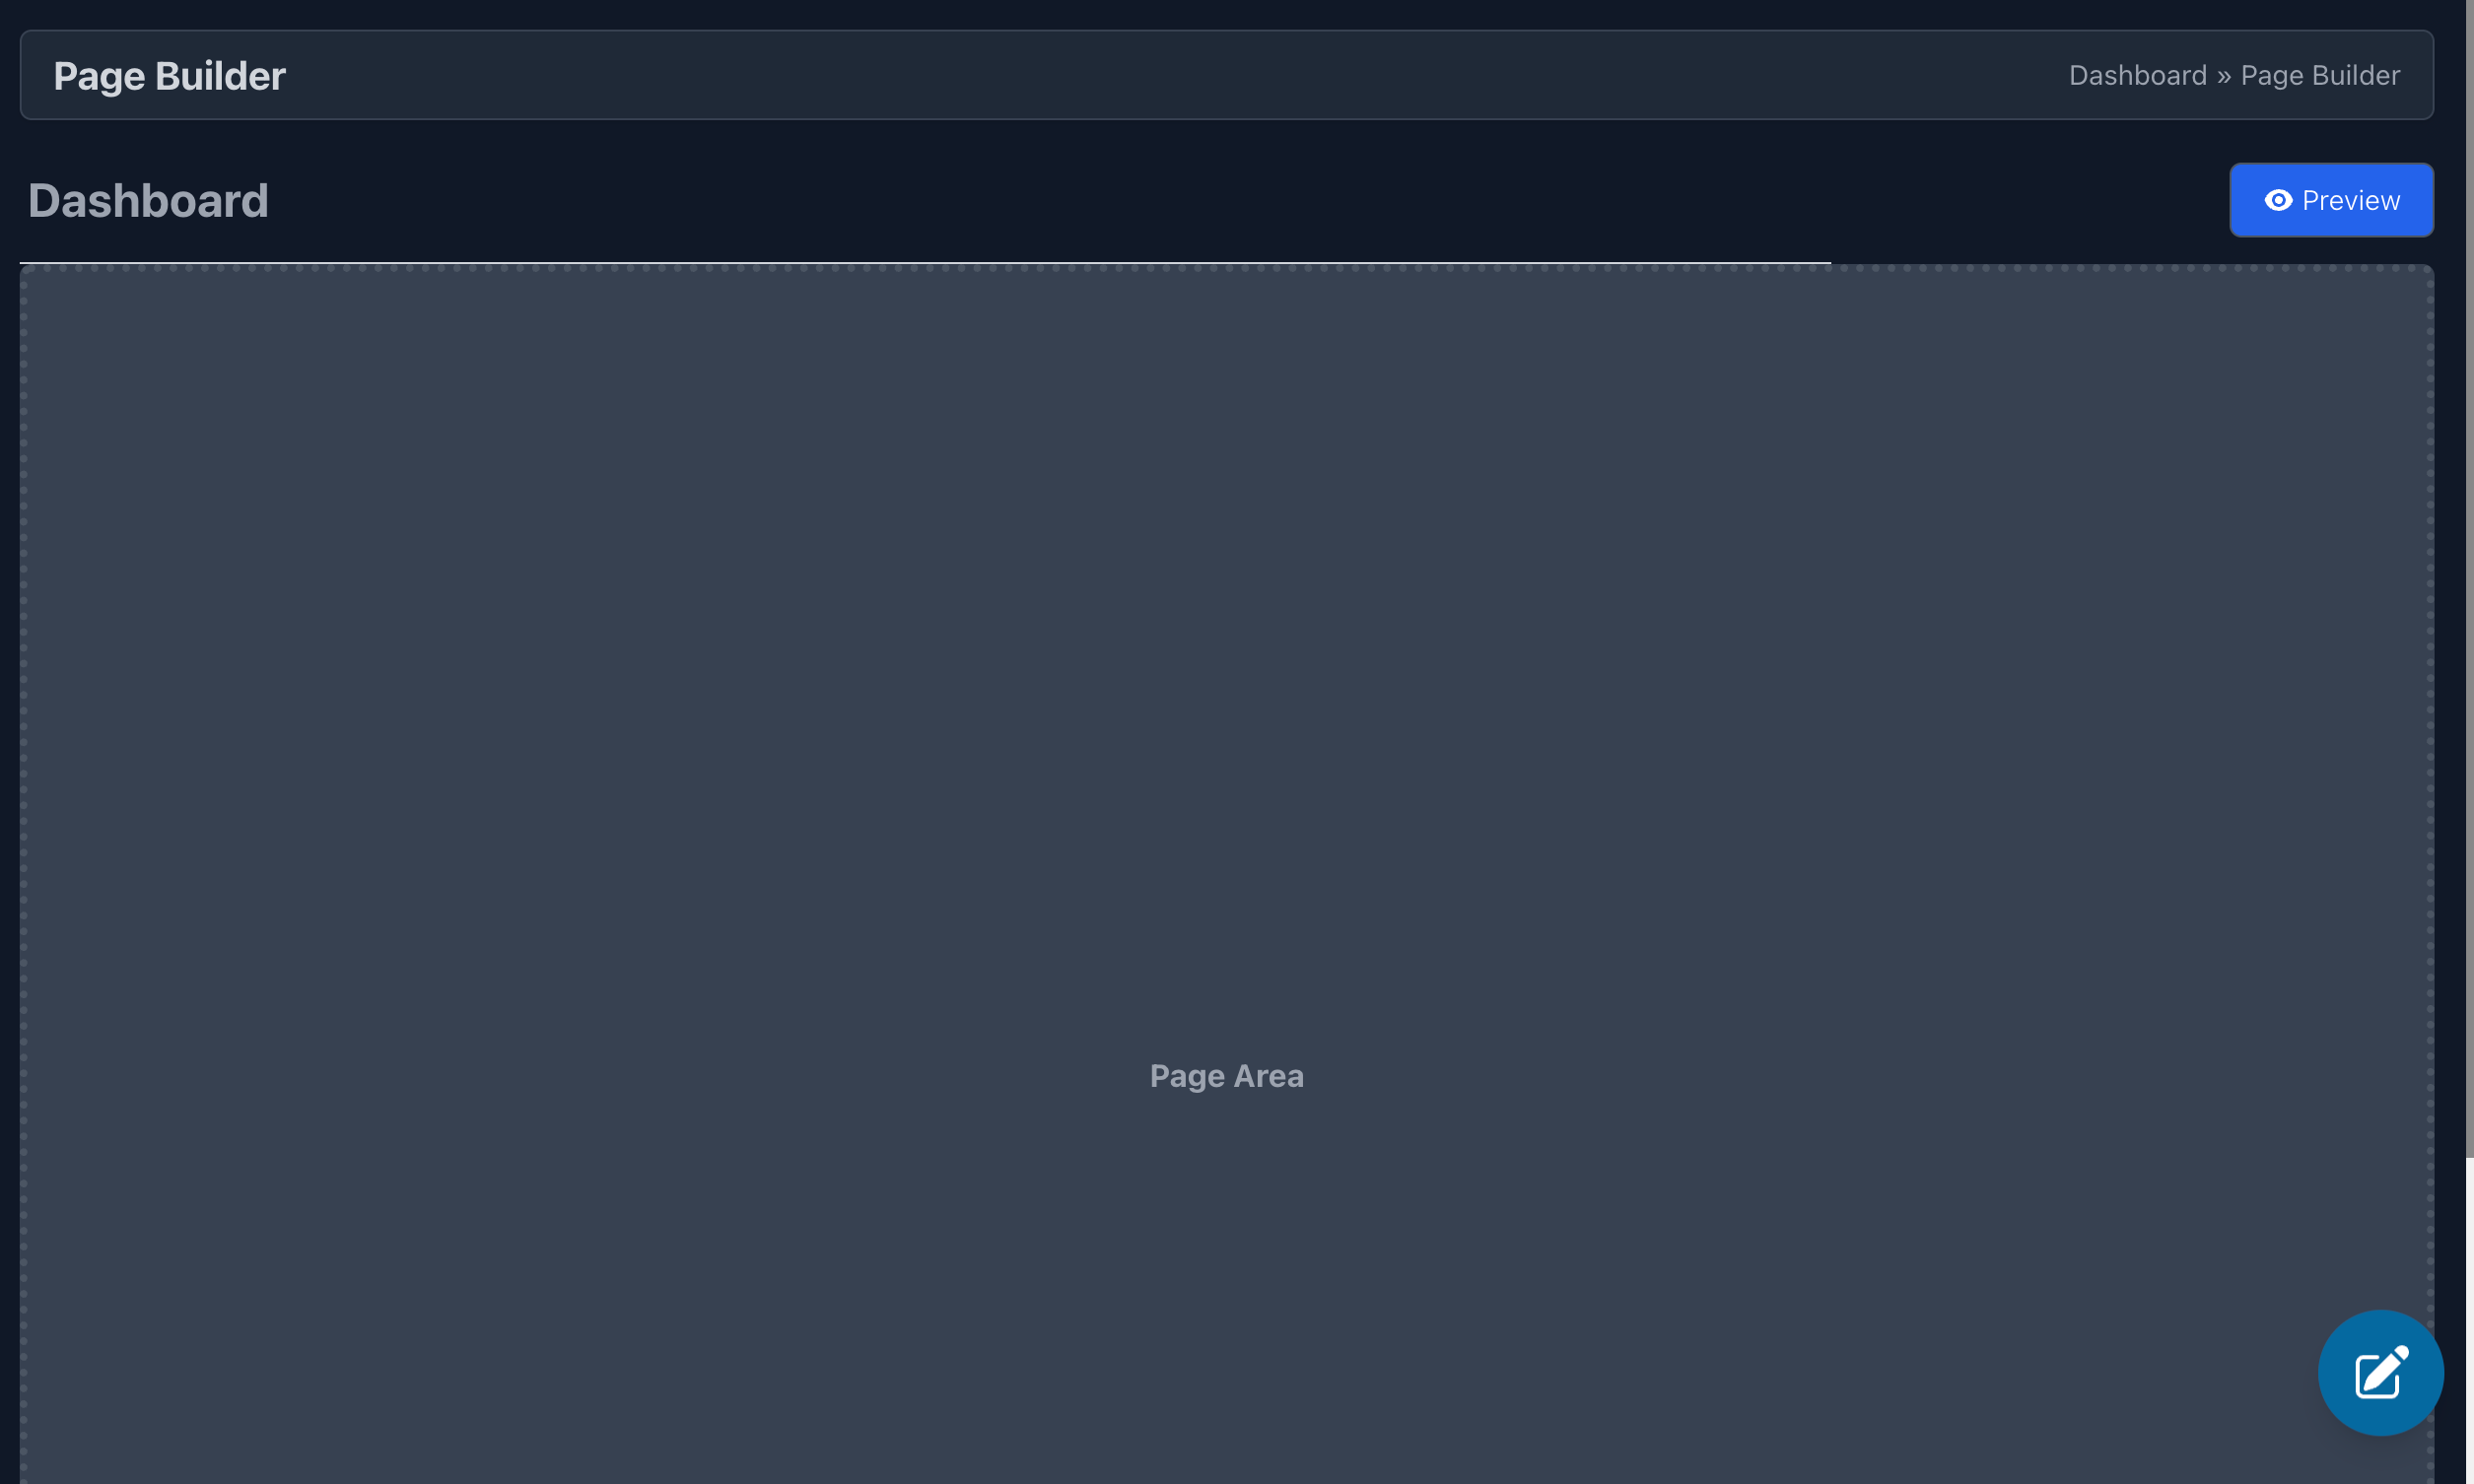
Step 1: Accessing Page Builder
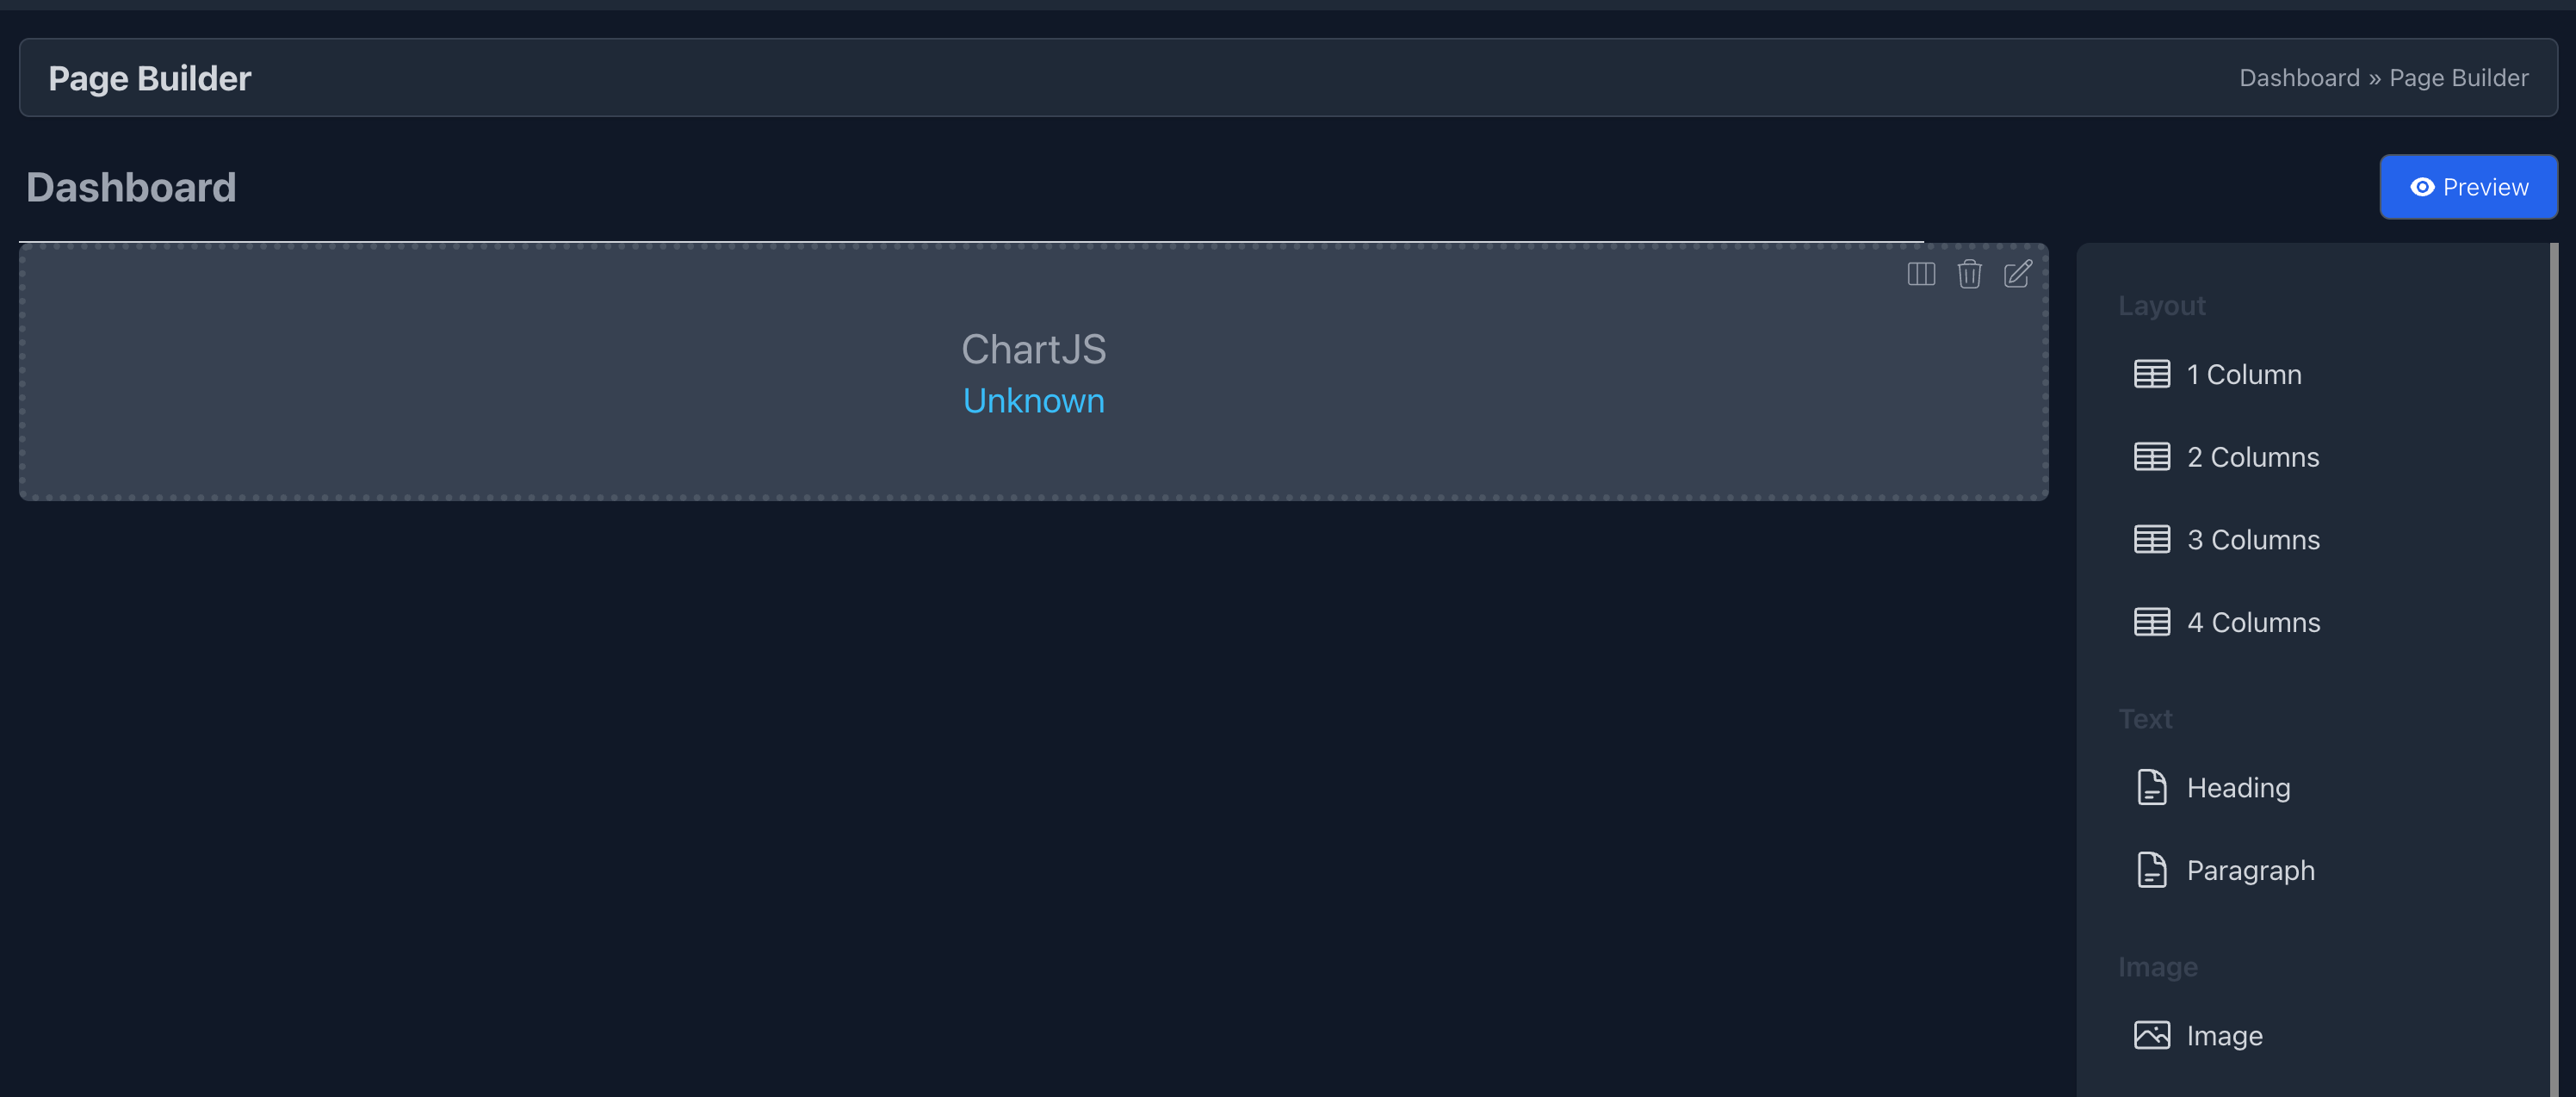
Open the Page Builder and enter the page name.
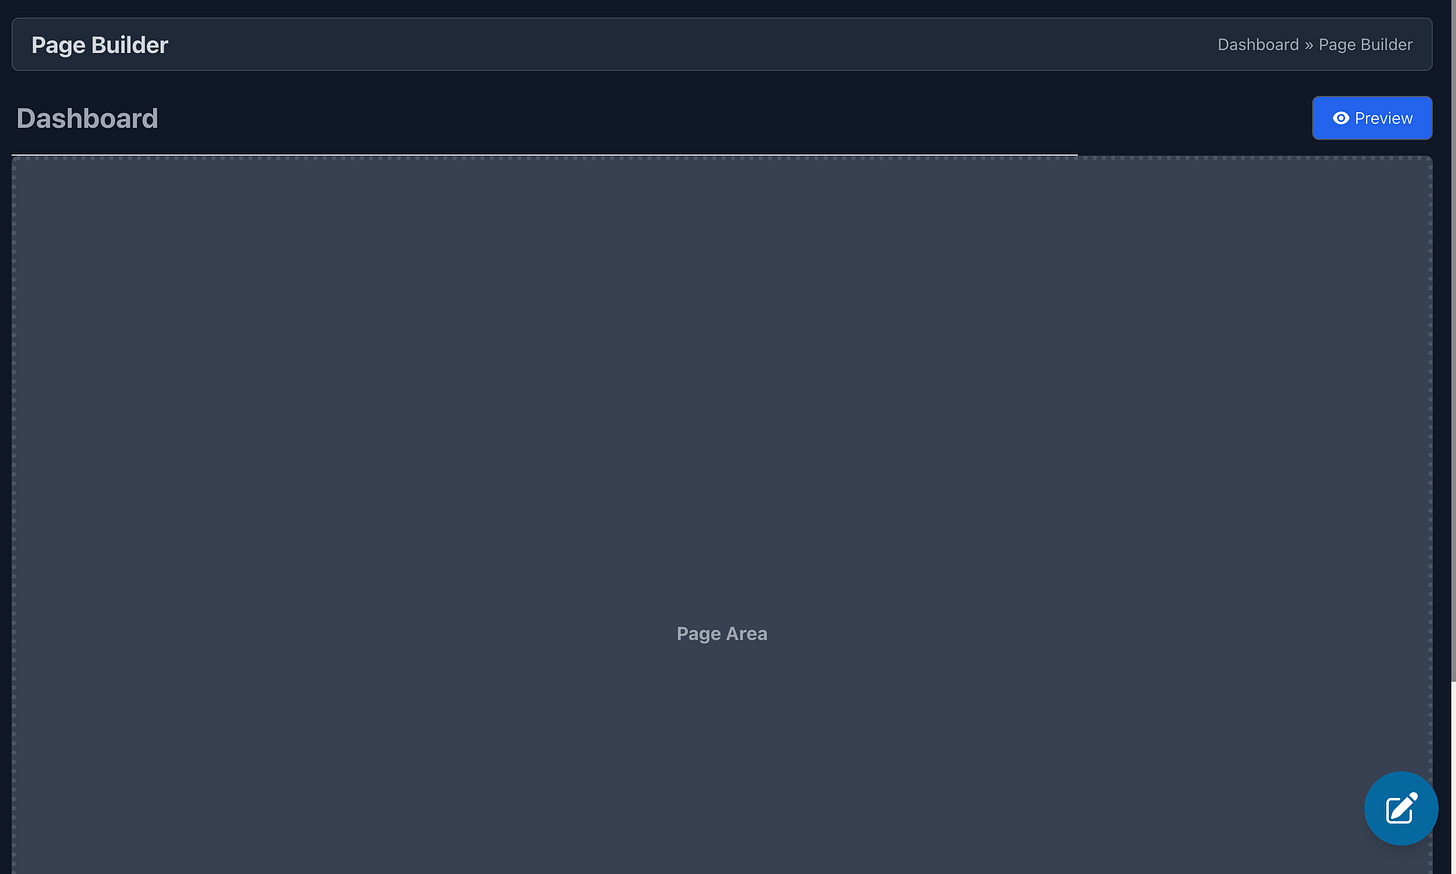
Click the pencil icon at the bottom right to enter the workspace.
(Embed image: Edit Button)
Step 2: Setting Up the Layout
This is where we add elements to the page.
First, drag a Layout Column element into the workspace.


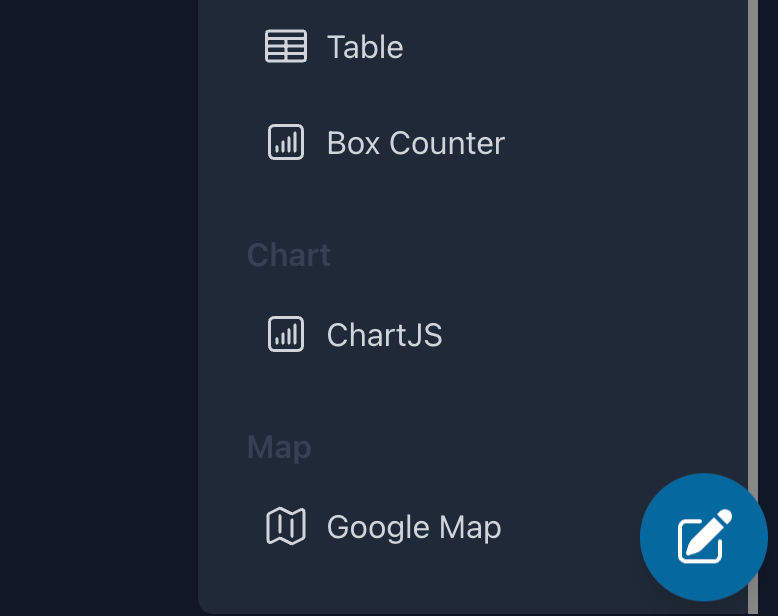
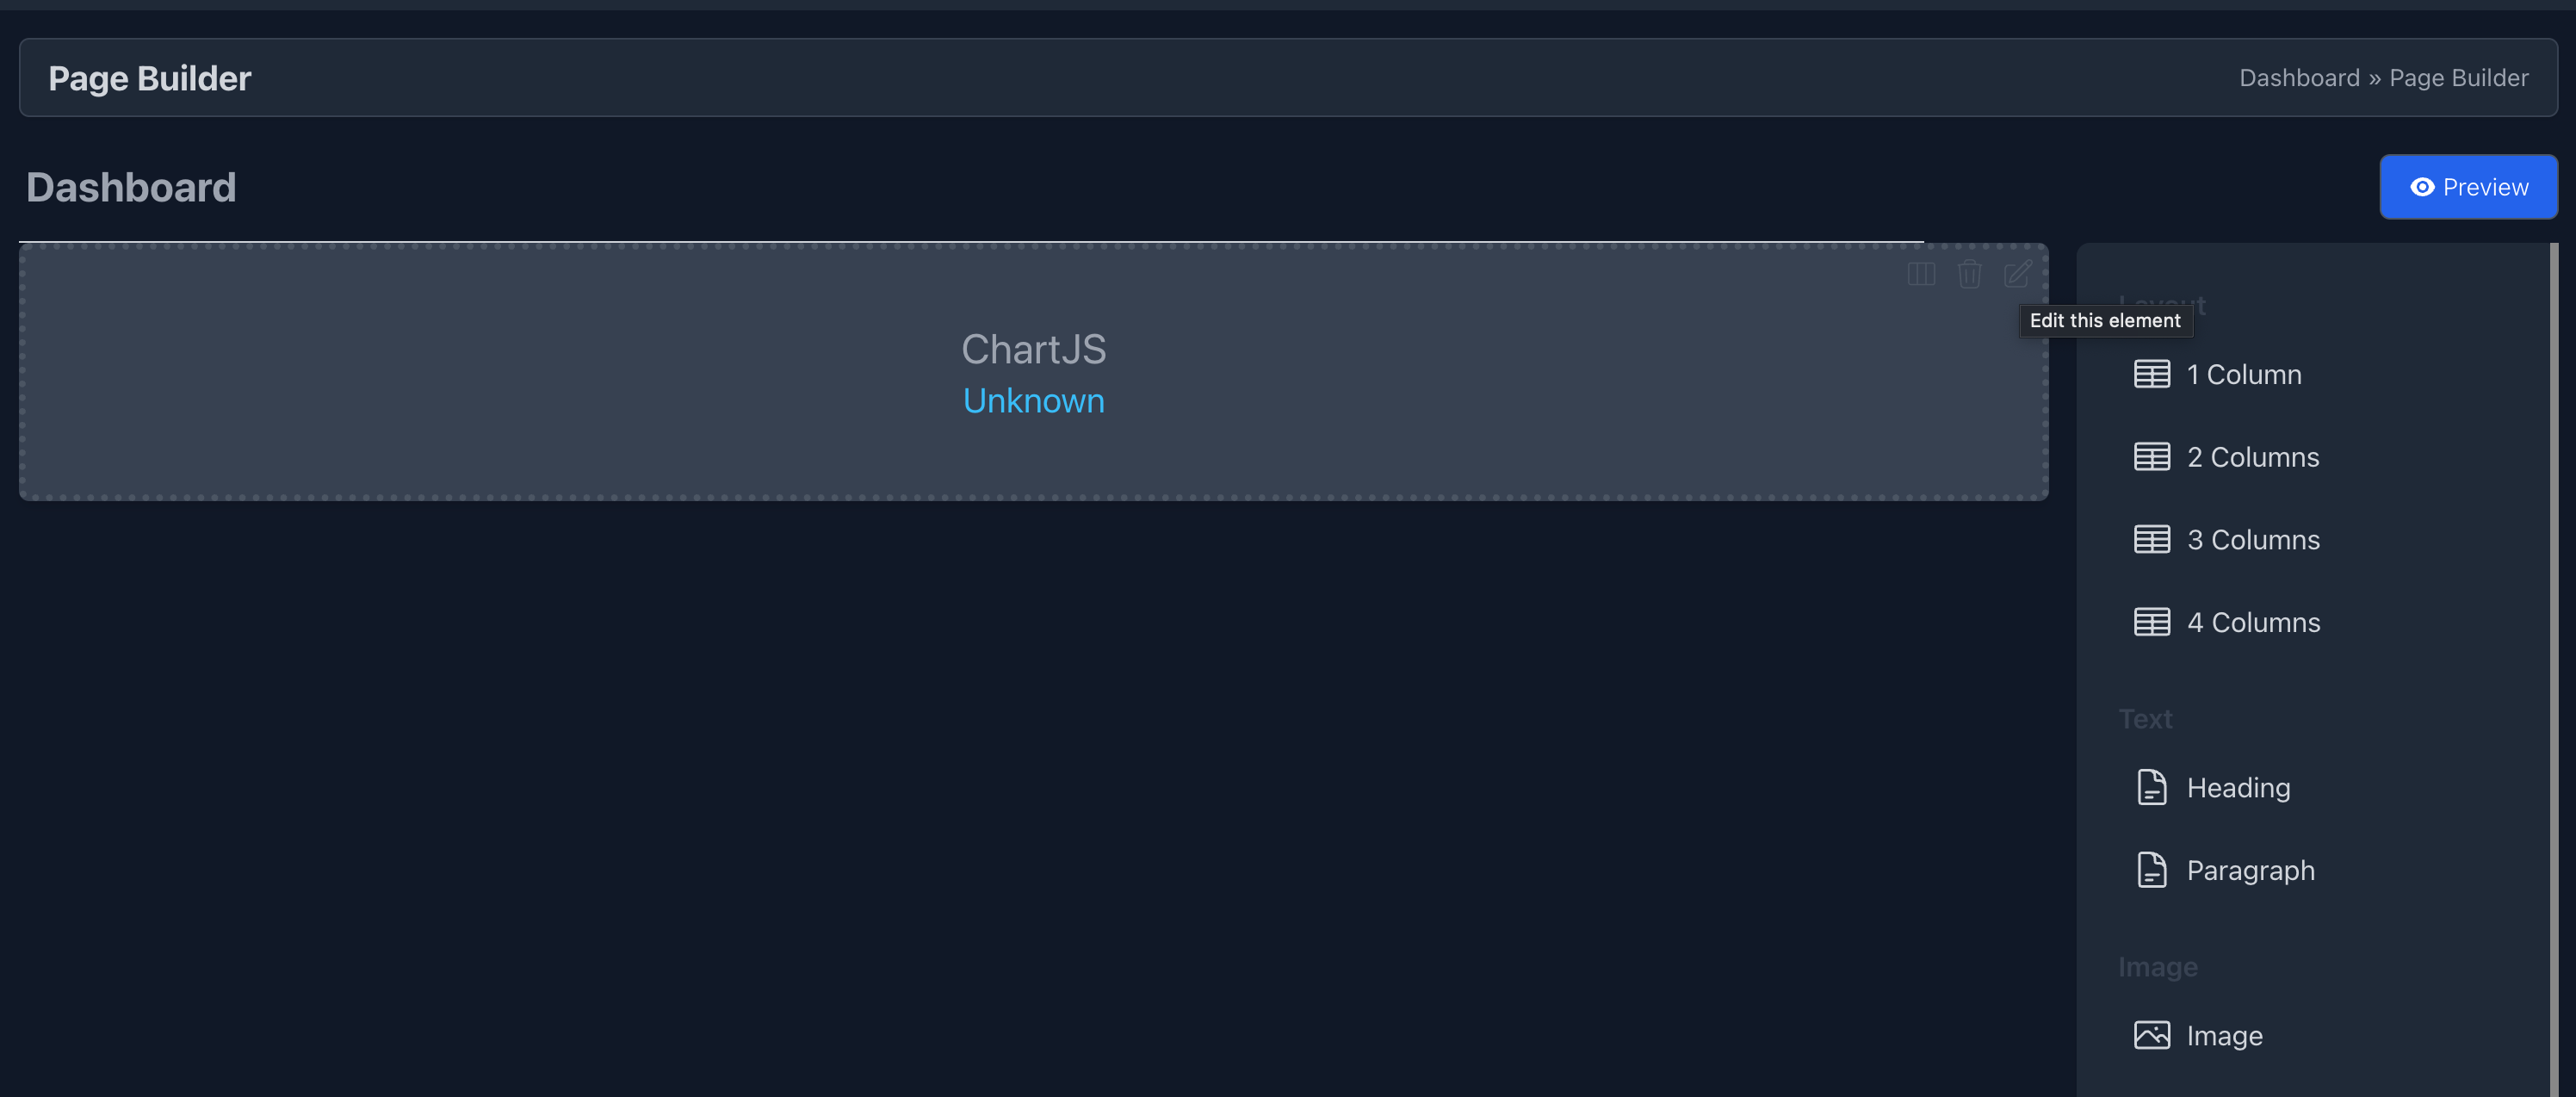
Step 3: Adding the Chart Element
Select the Chart.js element from the sidebar.

Drag it into the workspace.
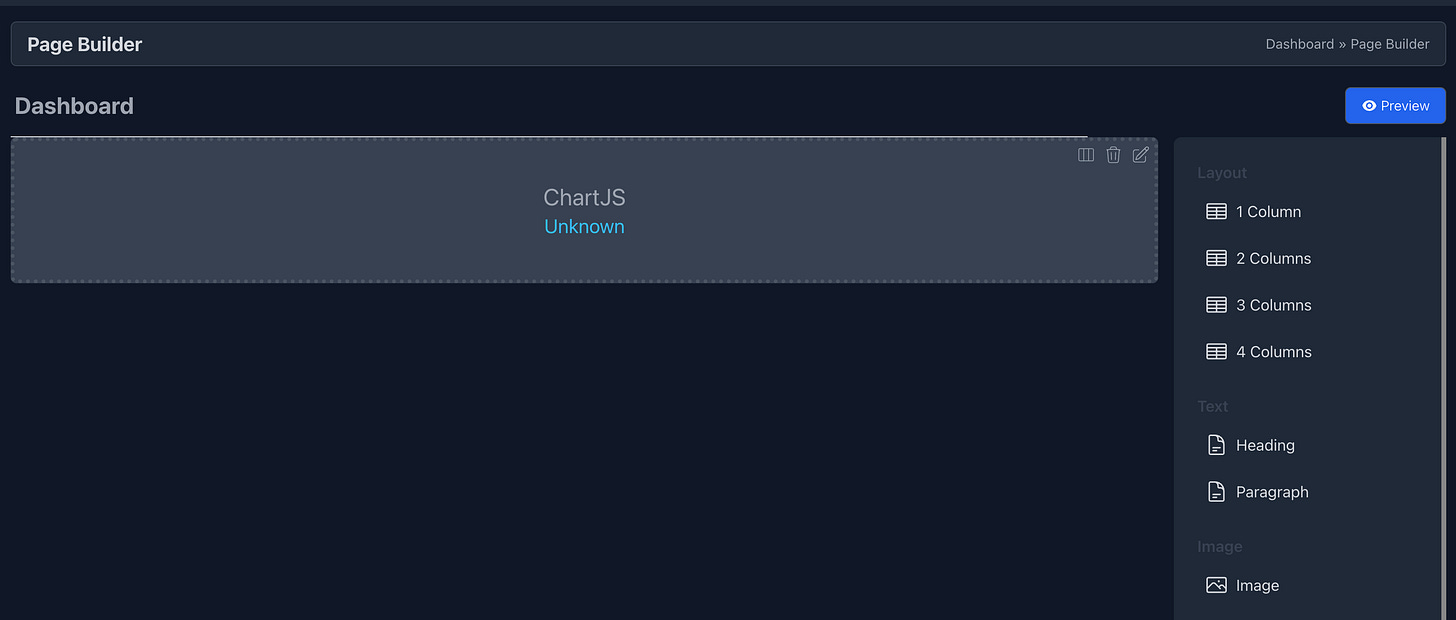
Click the Edit (pencil) button on the chart element to open the settings window.

Step 4: Configuring Chart Settings
Follow these settings for a consistent test setup.
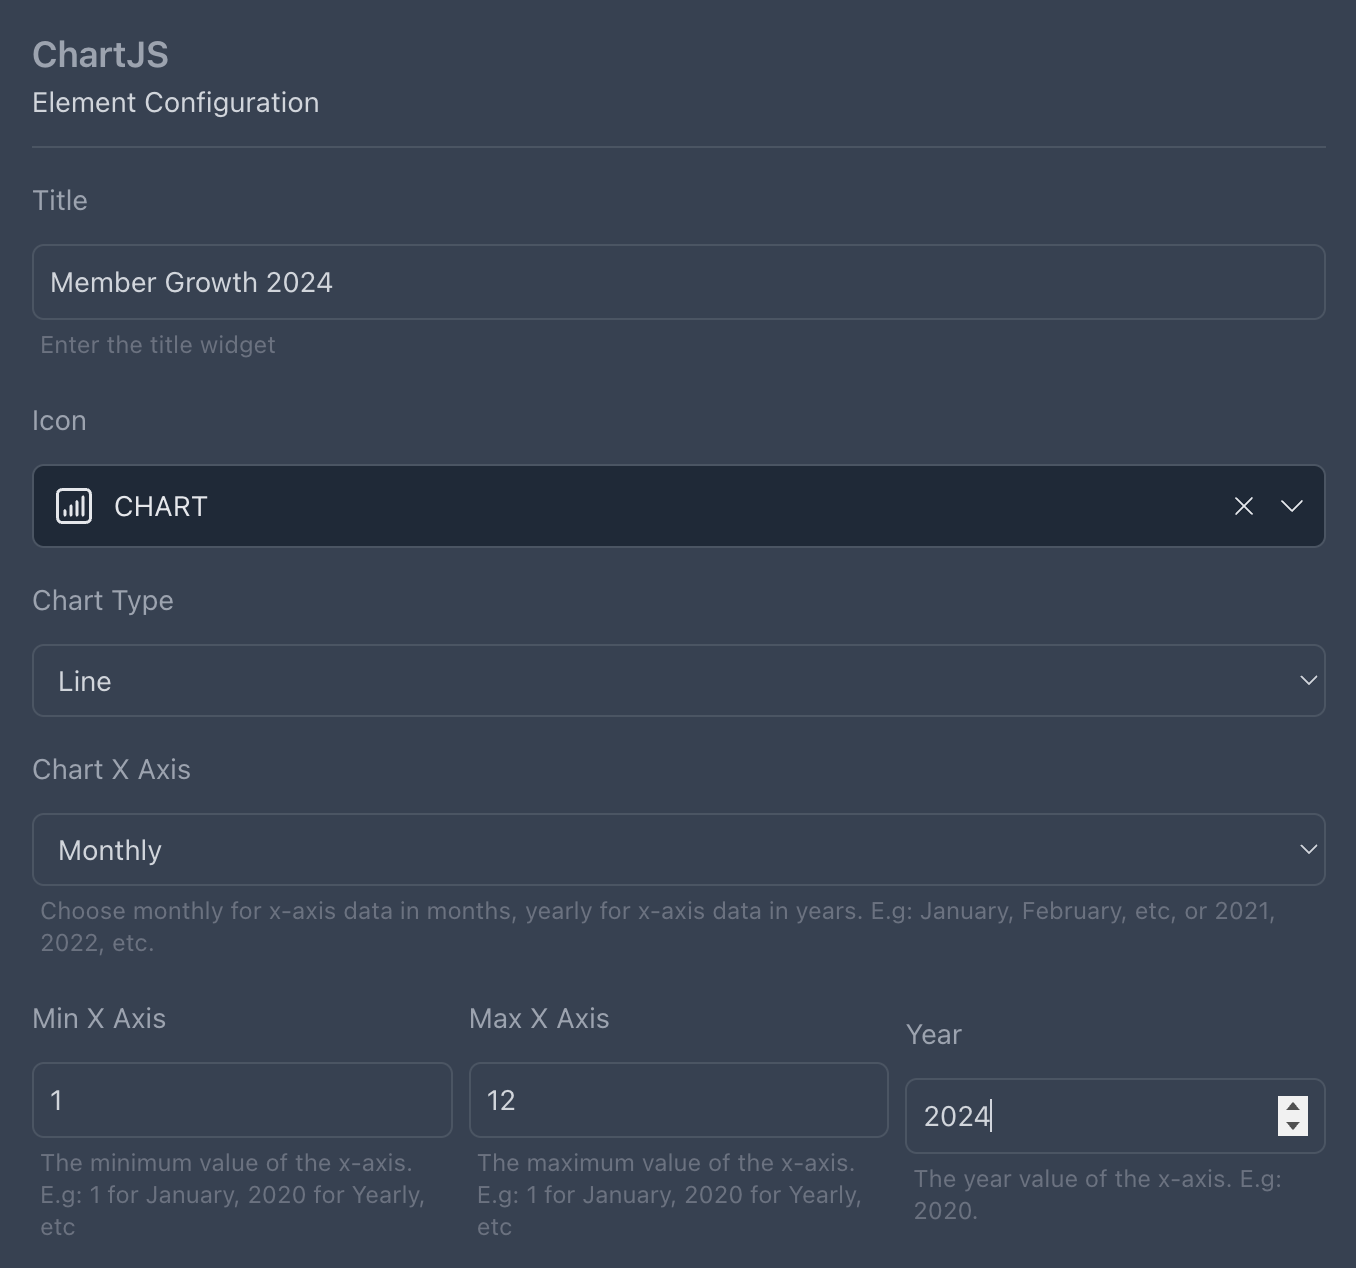
Basic Information Section
Title: "Member Growth 2024"
Icon: Select a chart icon.
Chart Type: Select Line Chart.
Chart X Axis: Select Monthly to group data by months.
Min X Axis & Max X Axis: Set range from 1 (January) to 12 (December).
Year: Set to 2024.

Step 5: Configuring the Dataset
Dataset Title: "Member Growth"
Data Query: Select the data source using Query Builder.
Click "+" to create a new query.
Name: "Query Chart Member 2024"
Builder Mode: Select Raw Query.
Raw Query:
SELECT COUNT(id) AS total, MONTH(created_at) AS month, YEAR(created_at) AS year
FROM members
WHERE YEAR(created_at) = 2024
GROUP BY month, year
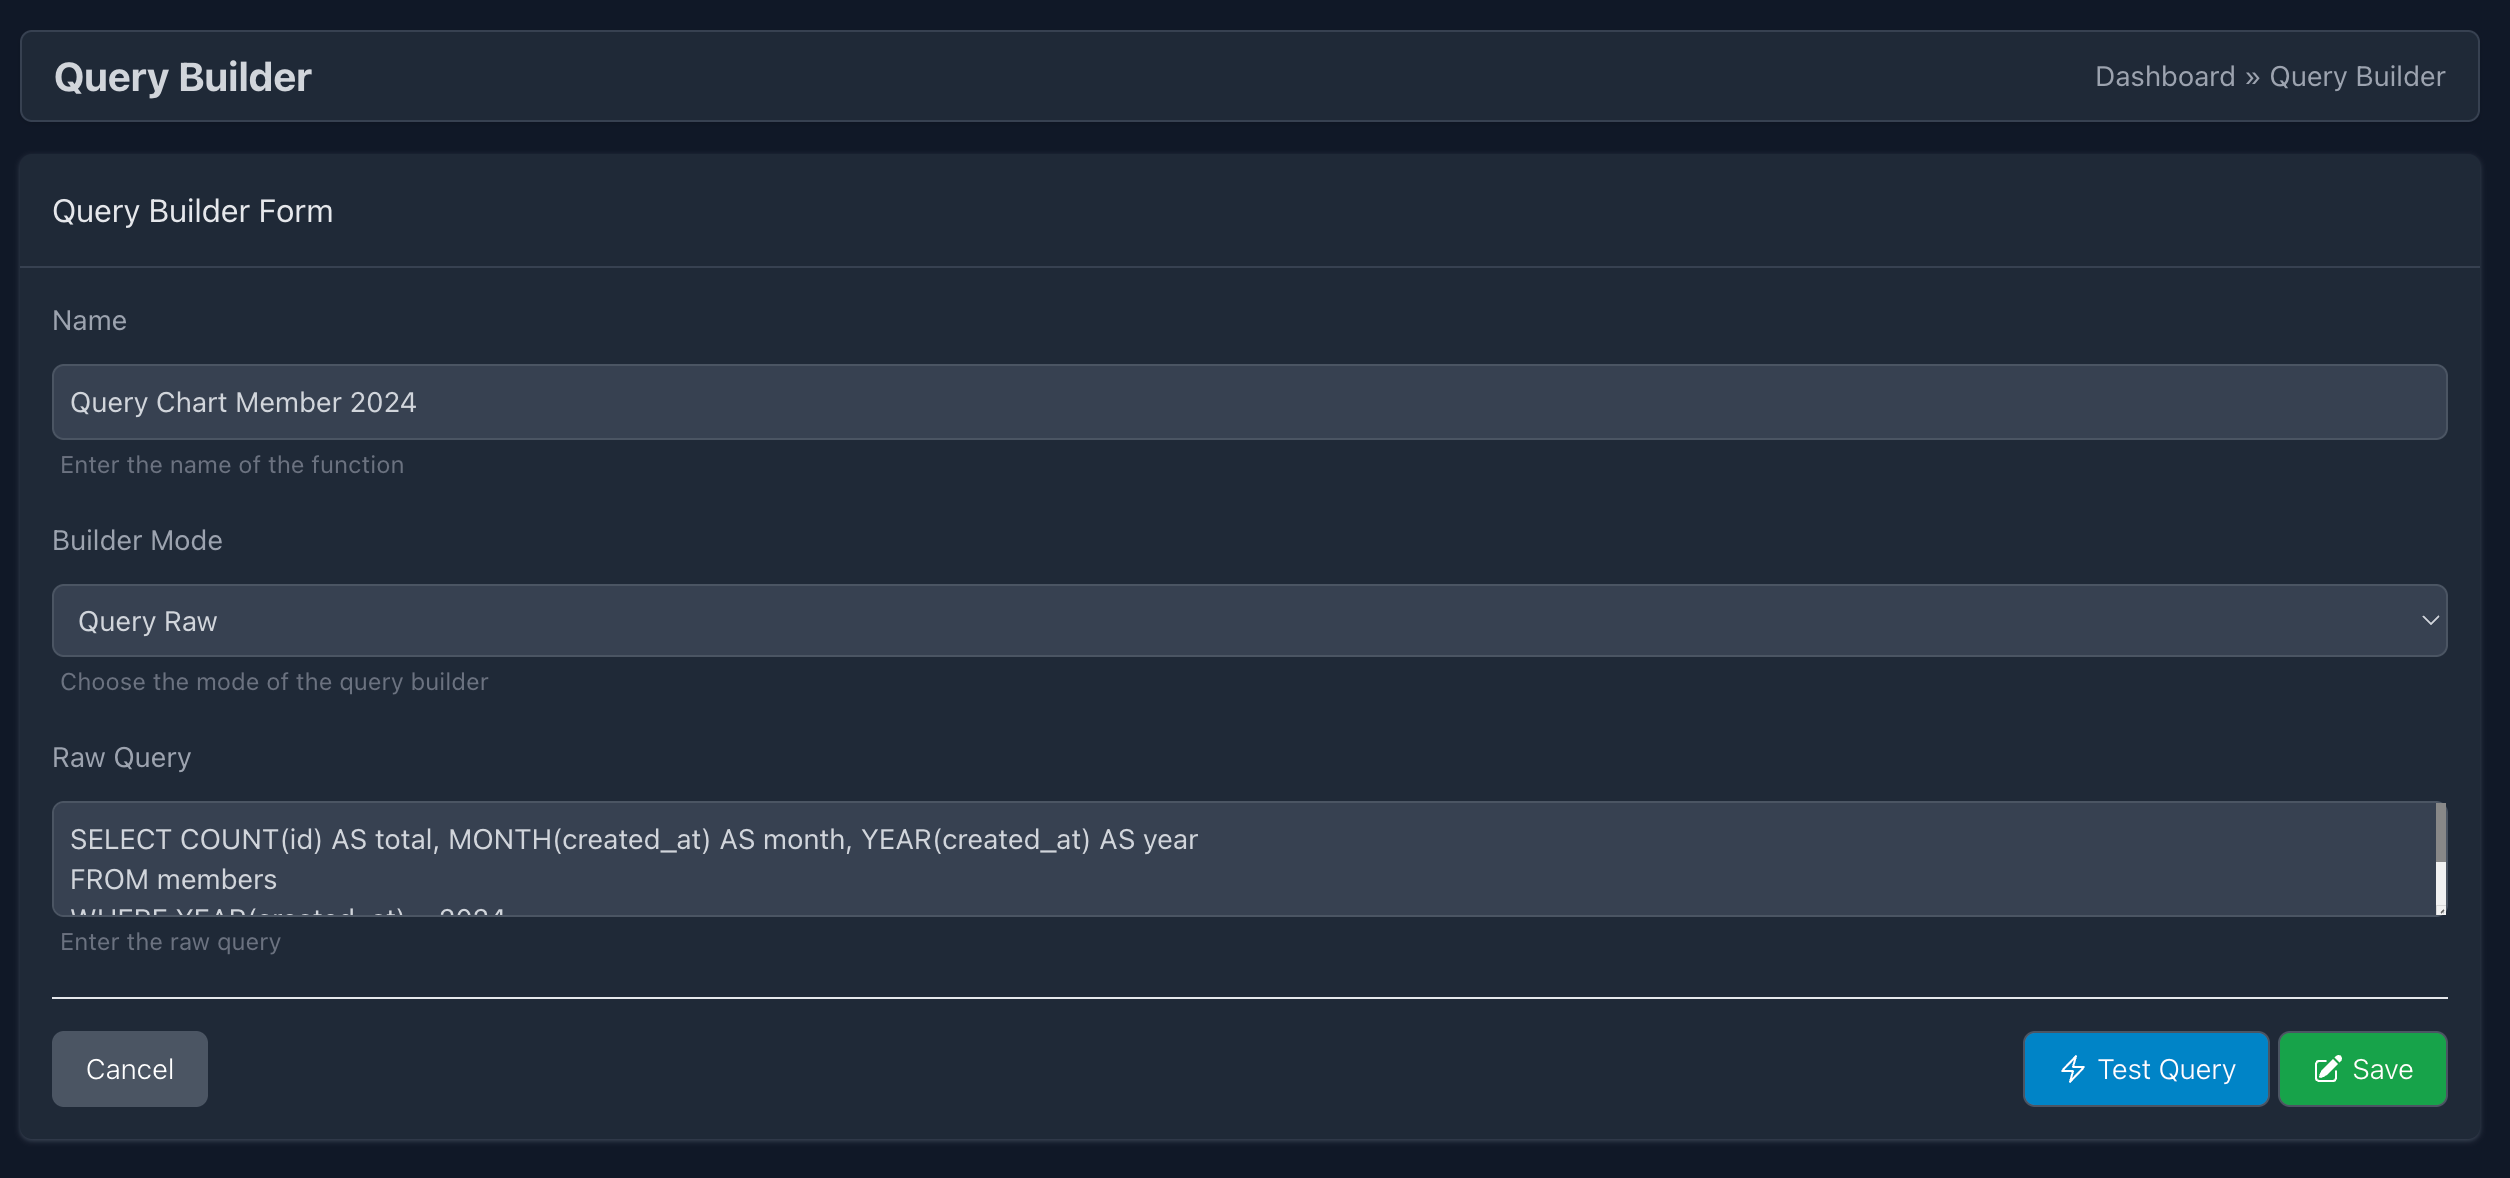
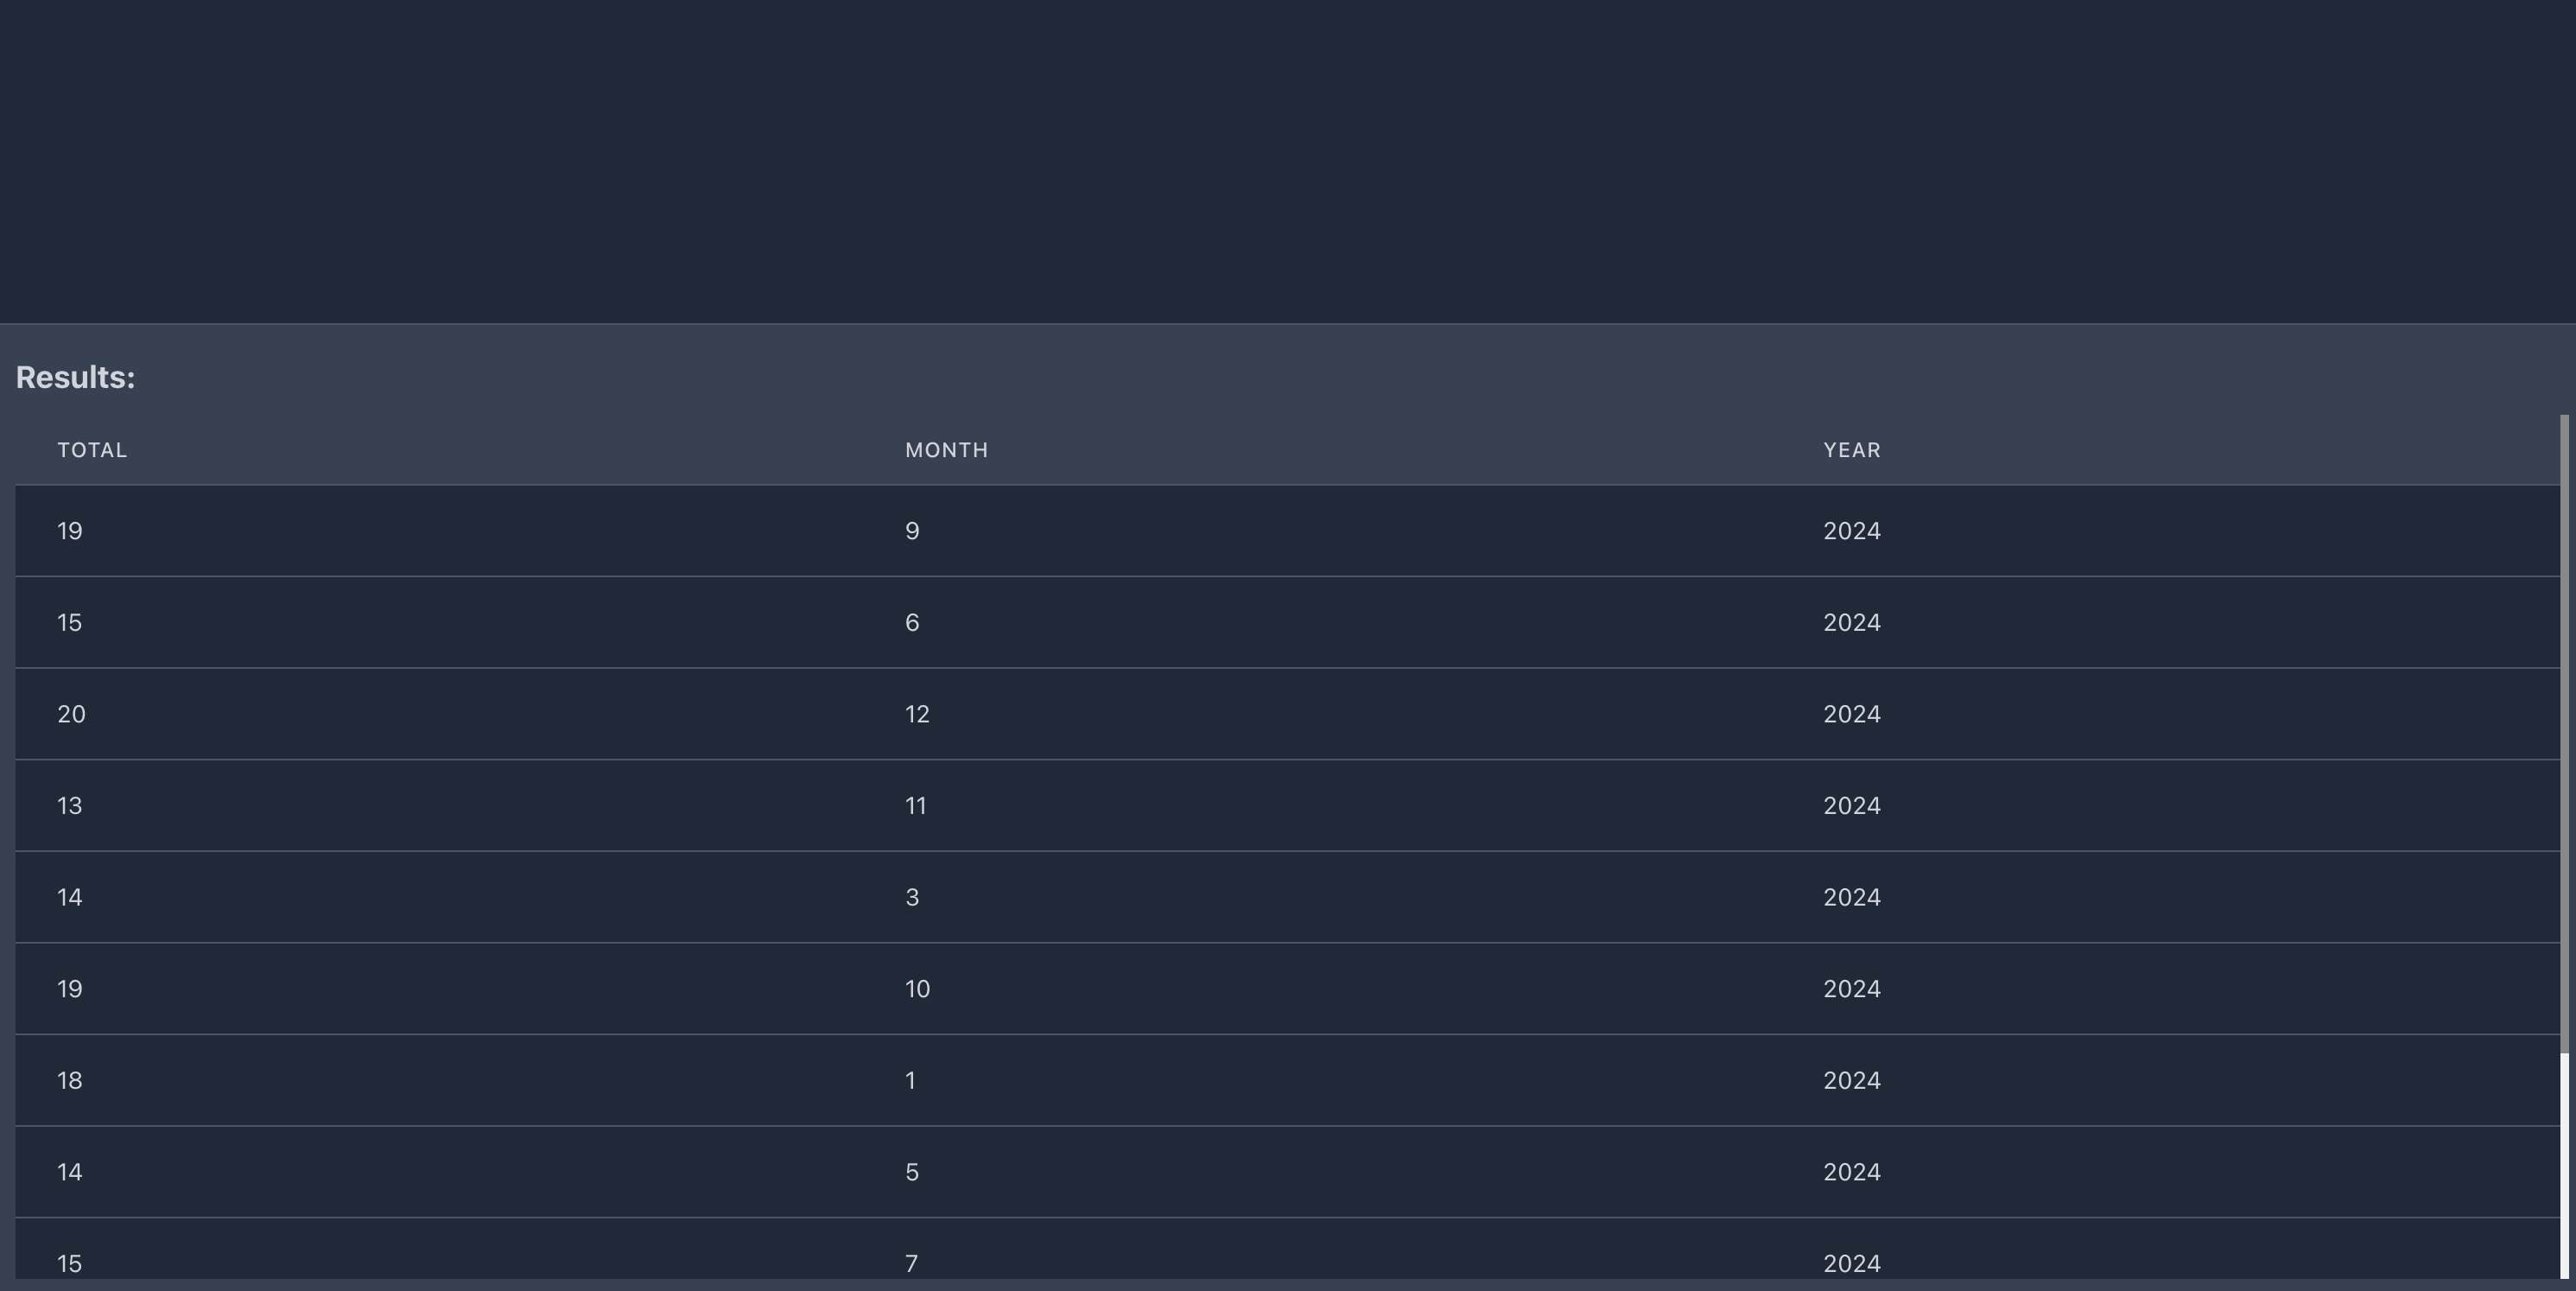
Click "Test Query" to verify output.
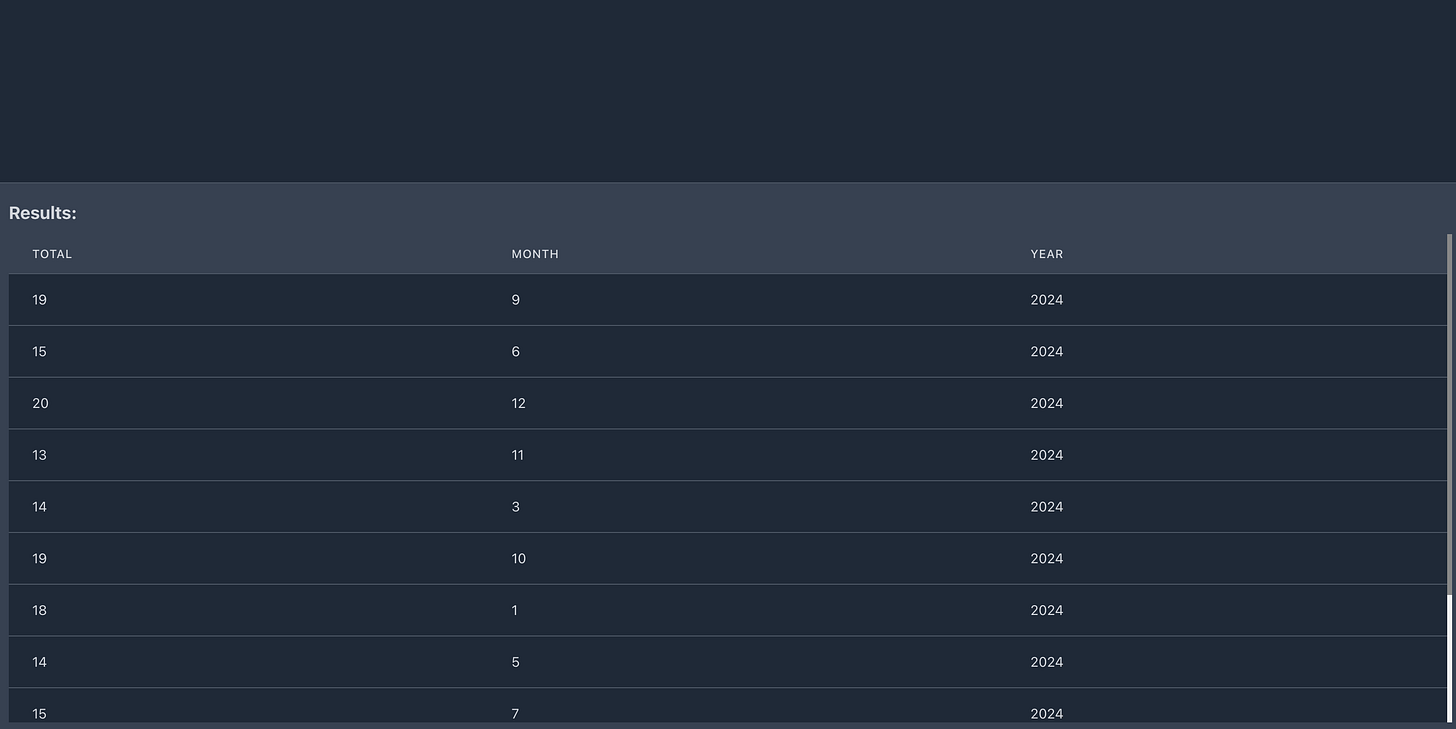
Click "Save" to store the query.
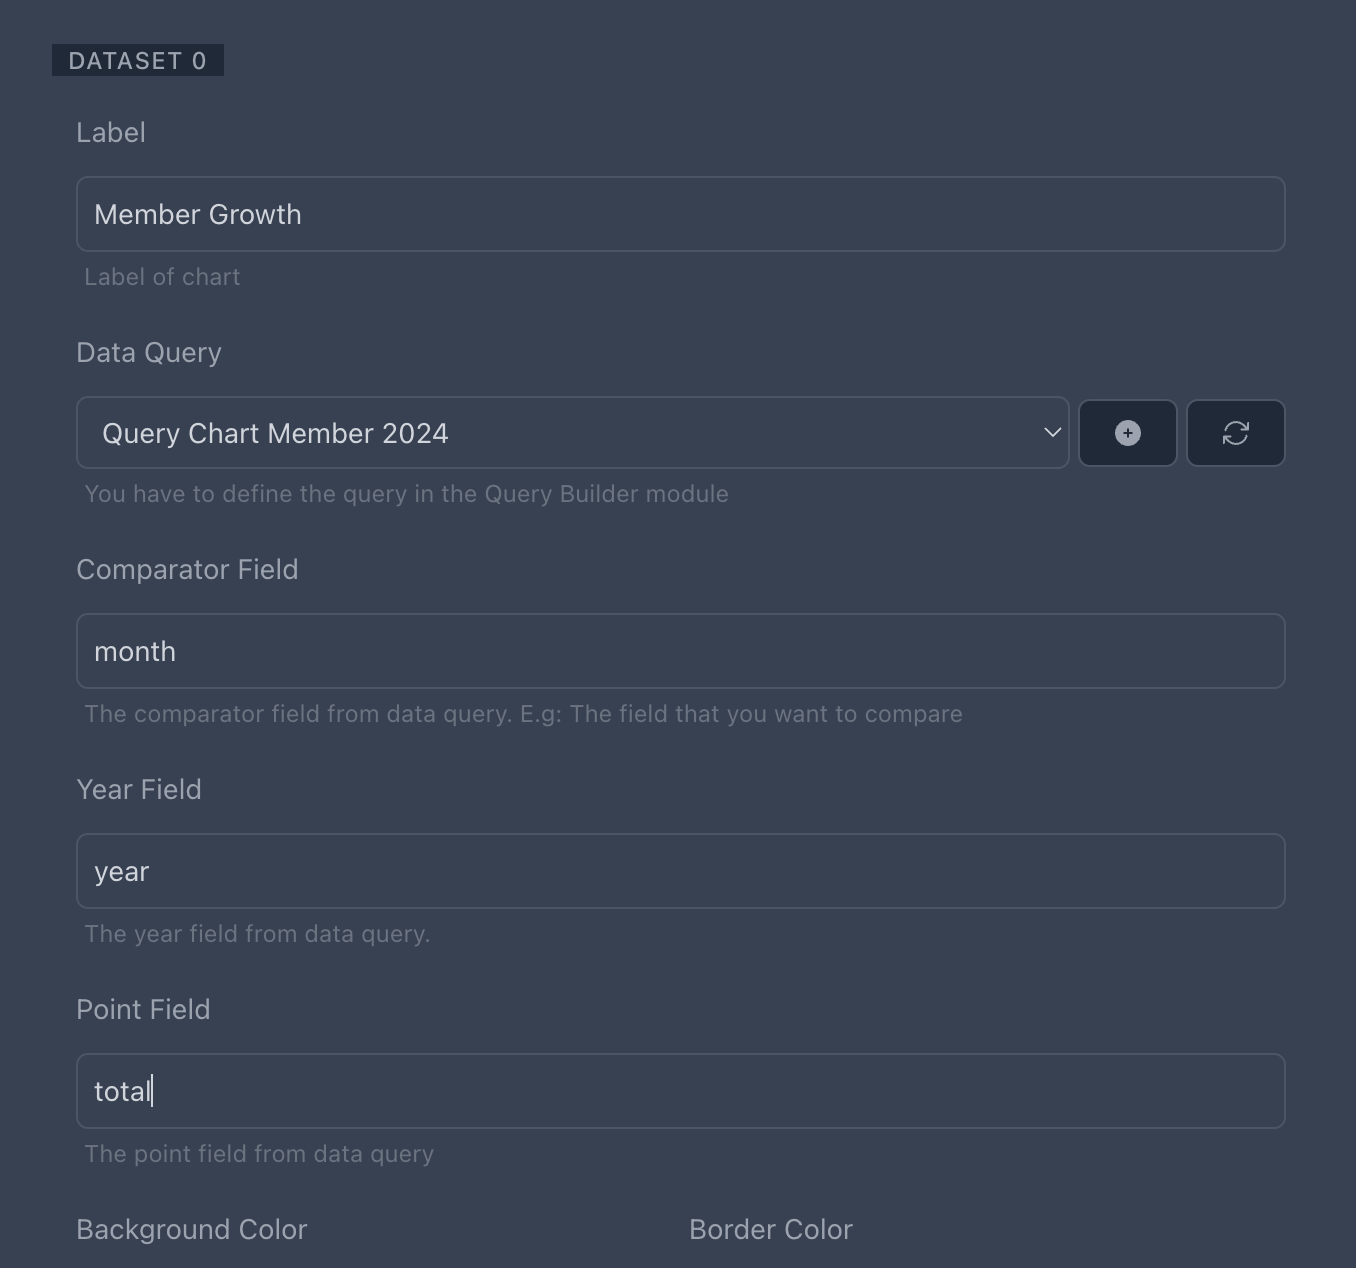
Return to the Page Builder tab, refresh the Data Query, and select the query created earlier.
Comparator Field: Enter "month" (used to group data on the X-axis).
Year Field: Enter "year" (used for filtering year-based data).
Point Field: Enter "total" (the count of new members per month).
Background, border, and stack settings can be adjusted as needed.
If you need multiple datasets, click "Add Dataset" to include more data series in the chart.
Click "Save", and your chart element will be successfully stored.
Step 6: Previewing the Chart
Click "Preview" to open a new page displaying the chart you created.
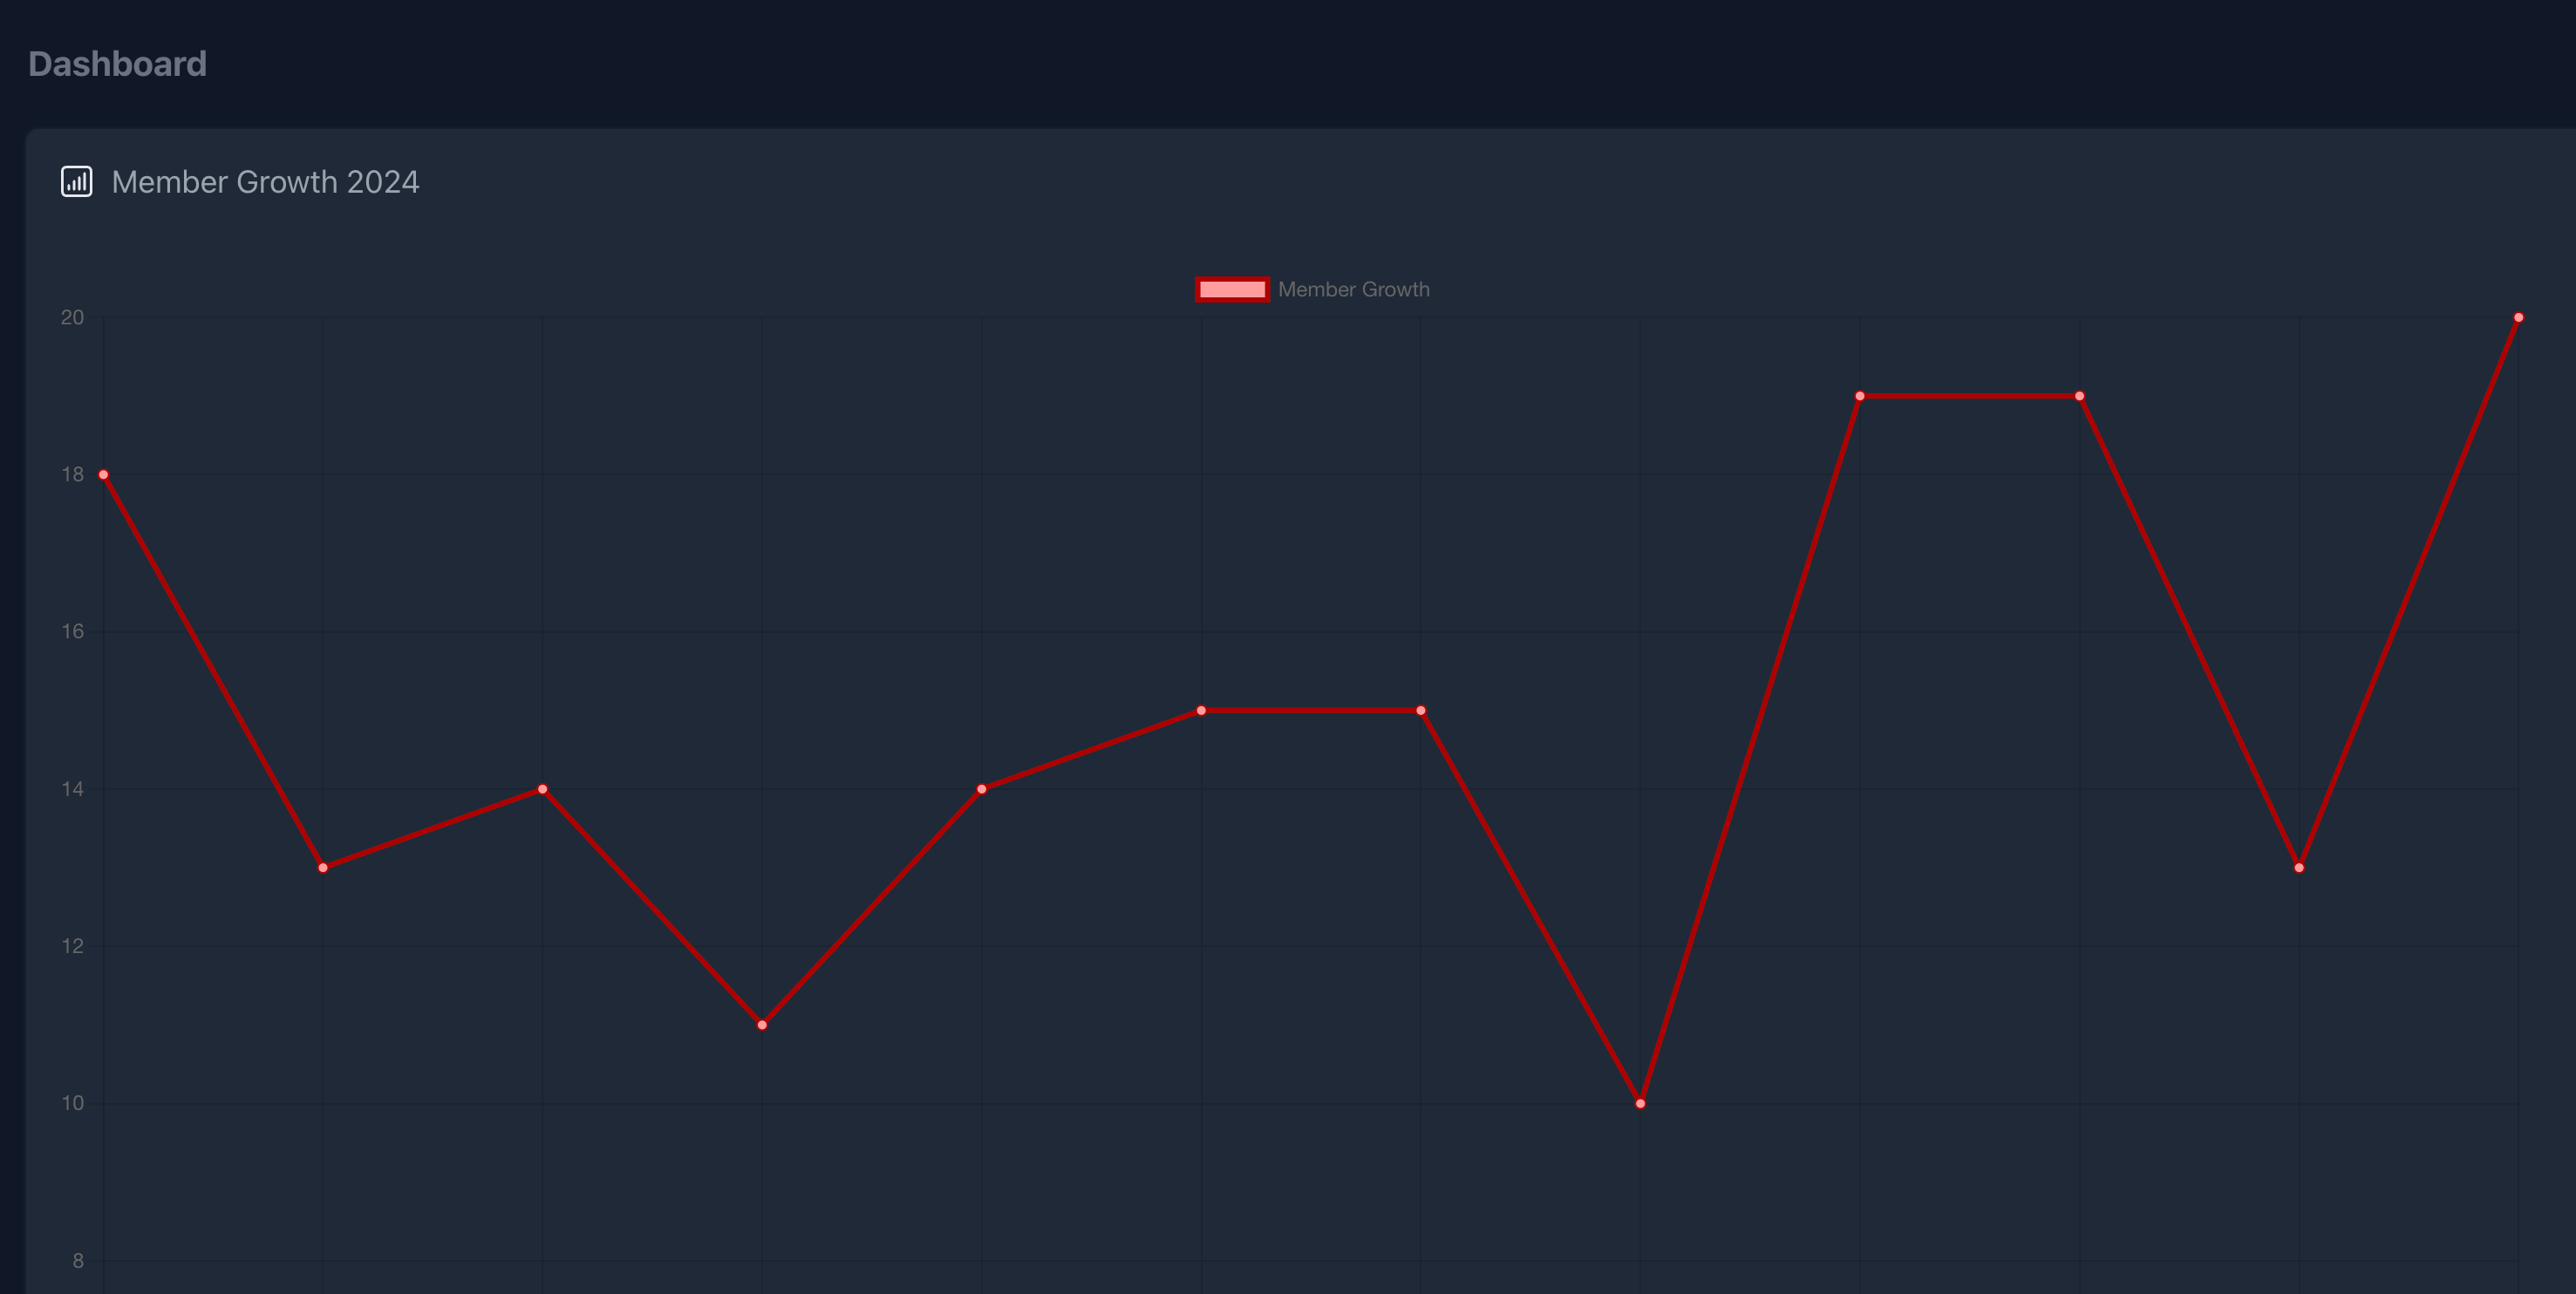
Page Builder automatically generates a unique URL for previewing the page.
Conclusion
With CRUDBooster’s Page Builder, creating interactive charts is effortless. You can visualize data dynamically, making your admin panel more insightful.
🚀 Next Steps:
Try different chart types (bar, pie, area).
Customize the color scheme and labels.
Integrate real-time data updates.
Start building your own analytics dashboard today! 🎉 Download CRUDBooster Now!